
Understanding SSD Performance Claims
Performance numbers are probably the most looked-at indications in any SSD datasheet. However, these numbers vary over the drive´s lifetime and over the time of transfers.Increases in storage capacity and the amount of sophisticated data processing being performed in modern systems, require a corresponding increase in data transfer speeds. Choosing a device based on exaggerated figures may lead to a system that does not meet its requirements.
It is generally understood that the real-world performance obtained from processors and storage devices is very different from that claimed in datasheets and benchmarks. Here we will look at what this means for flash-based storage such as Solid State Drives (SSD).
In the case of flash memory, this is not just the usual difference between unrealistic peak figures and application performance – even the raw performance numbers may not stand up to scrutiny in practice.
The two main measurements used to characterize an SSD are sequential access, where a large block of consecutive data is transferred to or from the storage device, and random access where smaller amounts of data are read or written to non-contiguous addresses. Sequential accesses are typically measured in megabytes per second (MB/s) while random accesses are usually given as input/output operations per second (IOPS).
The main factors that result in a difference between datasheet numbers and actual performance are:
- The differences between performance “out of the box” and after the device has been in use for some time (the steady state).
- Environmental effects, such as temperature sensitivity.
- Changes to the characteristics of flash memory over its lifetime.
Out of the box performance
We have carefully measured the real-world performance of several flash controllers, our own and some from competitors. To measure the difference between out-of-the-box and steady-state performance we use the CrystalDiskMark benchmark tool, then run a series of random writes for 72 hours before measuring the CrystalDiskMark performance again.
The difference in performance is shocking. In some devices that we have benchmarked, steady state speeds can be as little as 1% of the out-of-the-box performance.
What is more surprising is how quickly the performance falls off. In nearly all the drives tested, the performance decreased dramatically after about one and a half minutes of use.
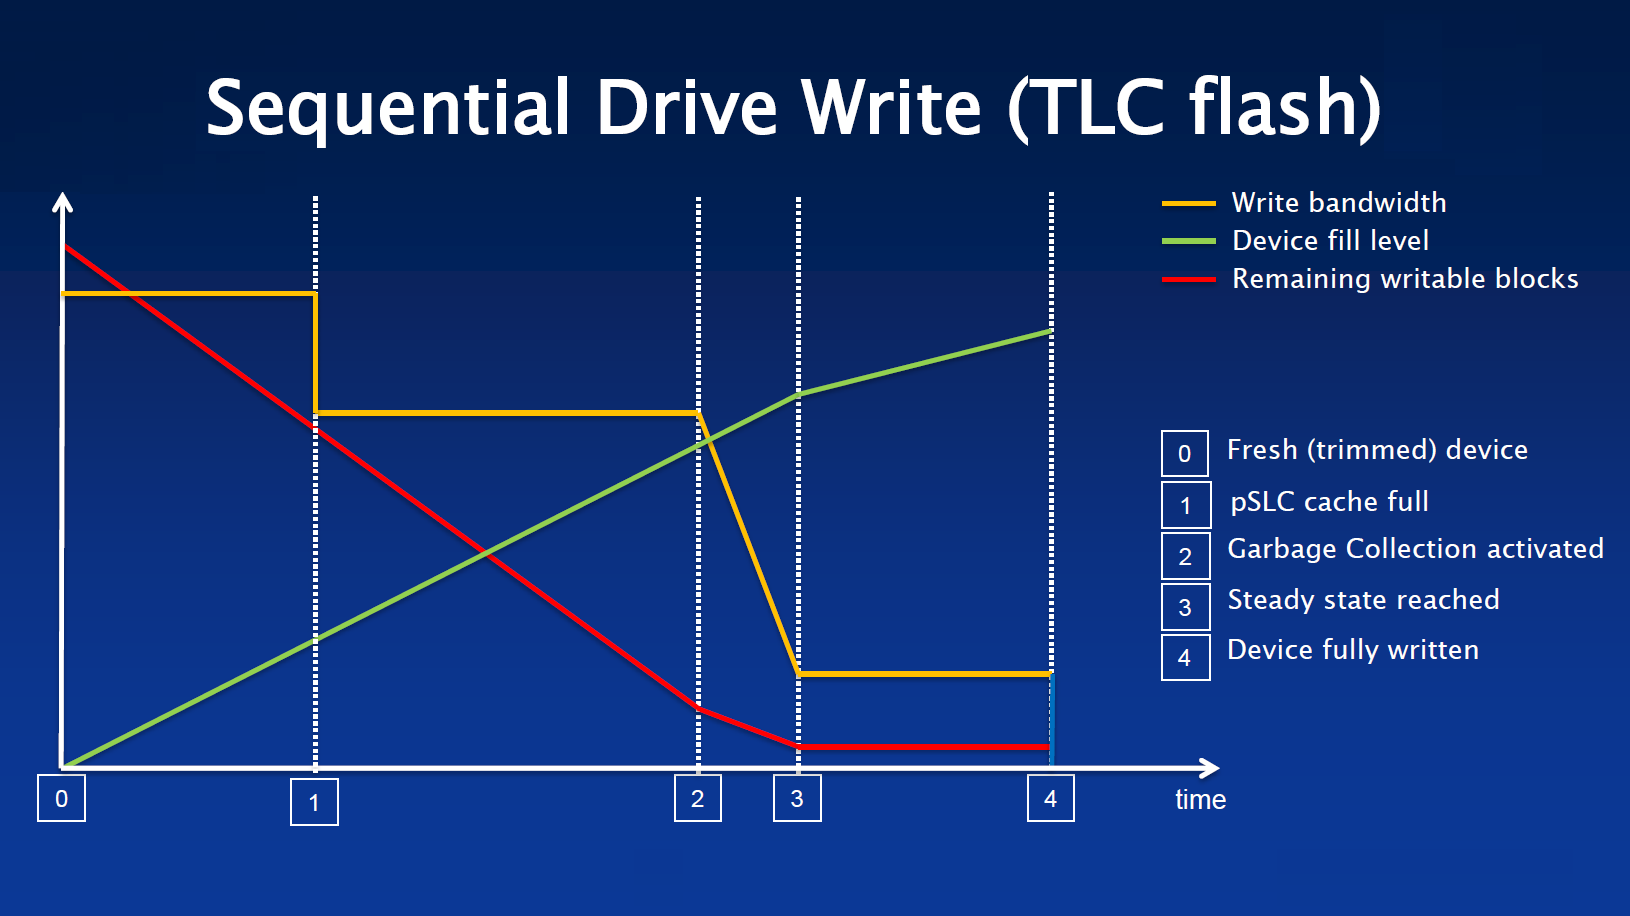
There are several factors that cause the performance to drop over time. One is that the flash controller has to execute various background tasks such as garbage collection, wear leveling, dynamic data refresh and calibration. The controller can “hide” the effects of these for a short time by prioritizing and scheduling the IO operations. However, for longer transfers these tasks inevitably have some impact on performance. Over the longer term, the time required for some of these operations increases as well.
Other effects include caches becoming filled and losing their effectiveness after long sequences of either sequential or random accesses.
Finally, during use the SSD will get hotter. To protect itself from overheating, “thermal throttling” is employed. This limits the performance in order to reduce the power consumption and thus lower the temperature of the device. The effects of this will be dependent on the ambient temperature, the thermal design of the environment and the workload. This makes the effects on real-world performance hard to predict.
Lifetime changes
The performance of flash memory also changes over the lifetime of the device.
To increase the storage density of flash memory, manufacturers now store multiple bits per memory cell. Triple-level cells (TLC) store three bits and more recent quad-level cell (QLC) memory stores four bits per cell. This higher density comes at a cost: the raw error rate is higher and the lifetime of the memory is shorter. To minimize the effects of increased error rate as the memory ages, soft error decoding techniques are used. These read the data multiple times and require sophisticated processing to calculate the correct data, both of which reduce the overall performance.
Over time, devices also become more sensitive to cross temperature effects caused by reading data at a different temperature than it was written.
As the flash memory becomes filled with data, background tasks such as wear leveling and garbage collection become more time consuming. This is because fewer free blocks are available for relocating data. This can also get worse over time because some blocks may be marked as unusable as a result of non-recoverable errors.
Conclusion
Device datasheets will typically show peak figures that can only be achieved by new devices under specific conditions, and only for a short period of time.
The actual performance achieved will depend on the patterns of data use, the environment and the effectiveness of the flash controller. It is important to understand the factors that can affect performance, but even more important to use real-world data rather than unrealistic performance claims.